“Every morning in Africa, a gazelle wakes up. It knows it must run faster than the fastest lion, or it will be killed. Every morning a lion wakes up. It knows it must outrun the slowest gazelle, or it will starve to death. It doesn't matter whether you are a lion or a gazelle. When the sun comes up, you better start running.” Thomas L. Friedman, The World Is Flat: A Brief History of the Twenty-first Century
Why a flat world? Because in every industry at every level, the middle man is being cut out and consumers are going directly to the source. The formal term for it is disintermediation – and we’re seeing it everywhere: Twitter and Facebook disintermediate the news industry; Uber and Airbnb the travel industry; Alibaba.com the retail industry by linking directly suppliers and buyers. Disintermediation is the foundation of the sharing economy.
But how does this radical external transformation translate to internal transformation for your company? What does the ideal organization look like in a flat world?
The companies prospering in the future might be the ones that take advantage of decentralized, self-organized, globally distributed communities working together to produce value. As the world flattens, we see organizations also flattening, challenging the intermediate levels. But they’re struggling to redefine the manager’s role. The org chart, while easy to understand, doesn’t represent how things get done or how innovation and value are created.
A better option is a network diagram. Managers can use network analytics to recognize, promote and efficiently distribute collaborative projects. Adjusting supply and demand at the level of their top collaborators will increase the success of the whole team.
Finding the top collaborators: who’s your Superman?
Networks are a good representation of complex human systems; they capture the interplay between the structure and the behavior of their components (teams or individuals). Network visualization allows you to detect communities or clusters in partitioning the network so that links or exchanges within communities are denser than the links between communities.
Consider professional sport teams -- they don’t just measure goals, they also track assists. The sales person closing a strategic deal (scoring the goal) is only one part of the story. What were the assists (customer relationship management activities, for example) that helped make the sale? In order to analyze the assists to projects in your organization, and the value directly and indirectly tied to your employees, start by examining your network and asking two basic questions:
- What is the underlying structure linking the different projects and activities to cohesive groups, teams and employees?
- How are the groups linked to each other and who are the bridges between the communities?
As we can see on the following network graph, cohesive groups or clusters exist within organizations and within those cohesive groups, individuals are able to quickly share resources, information and typically demonstrate higher levels of trust than in less cohesive groups.
The individuals who act as bridges from one cluster to another are crucial: They have wider access to diverse information, early access to new information and control over the distribution of information. They are, in fact, key to winning deals and successful projects.
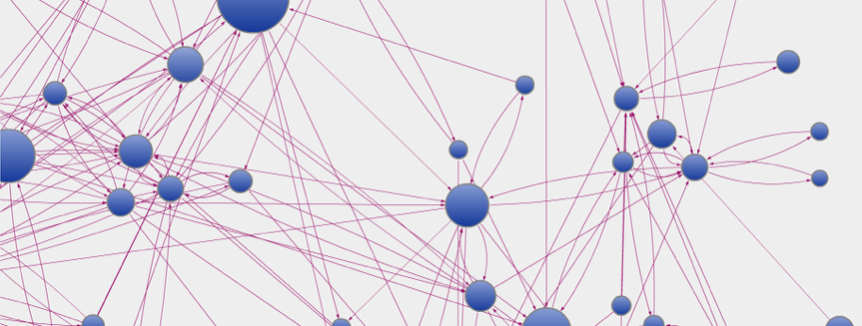
In the following anonymized network extract of SAS employees, the employee at the center of the highlighted cluster is our Superman. He’s our hyper-collaborative bridge between different departments and virtual teams.

Network analytics can likewise identify critical nodes in projects within company networks by plotting different types of employee scores. The following Visual Analytics graph shows the collaborations between anonymized SAS employees in the context of successful projects (assists for a goal) for a specific period of time.
Two employees are connected if they’ve collaborated on a deal we won. The more times they’ve collaborated, the stronger the connection (grey arrows are for weak connections while pink arrows are for strong ones). Employees that collaborate often and participated in a lot of successful projects have more influence in the graph. This is indicated by the color of their nodes in the first graph (sum of the value of their assists in the context of won deals) and by the density of their directed connections.
.png)
Once you have discovered your supermen and superwomen, another challenge rises: defining what is their kryptonite (the one thing that renders them helpless). That is what our next blog entry will be about.
Do you want to know more about analytics and its impact in your organization? Then the SAS Forum will be the ideal opportunity to learn more about it!